Fishbone Diagram Template in Excel
Tired of Trying to Draw Fishbone Diagrams Manually?
Use the Ishikawa diagram or fishbone diagram template in Excel (a.k.a. cause and effect diagram) to conduct Root Cause Analysis of delay, waste, rework or cost.
Create a Fishbone Diagram in Three Easy Steps with ChartSmartXL
![]()
- Point - to the Ishikawa Fishbone Diagram, on the ChartSmartXL Menu, in Excel:
- Fill in the Blanks - Select the style of fishbone analysis you want (Cell F10) and then input your text in the yellow shaded cells. When you are done, click "Create Fishbone":

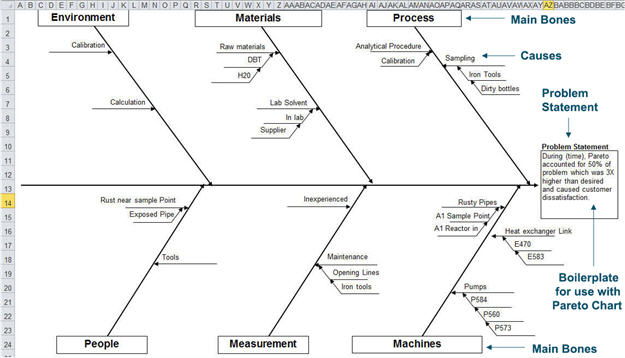
- Analyze and Improve - ChartSmartXL will automatically create a fishbone diagram for you:

If you want to copy the fishbone diagram from Excel to PowerPoint or Word, go back to the "Outline" sheet and click on the blue "Copy" button. You can then paste the fishbone diagram as either a picture or drawing object. Pictures are static. Drawing objects can be revised.
You can also use Excel's drawing tools (Insert Shapes [XL2007+] or View-Toolbars-Drawing [XL2000-2003]) to customize the fishbone diagram.
Watch Video of Our Automated Fishbone Diagram Template
Learn More...
- The Key to Fishbone Analysis - the 5 Whys
- Customizing the Fishbone Diagram
- Types of Ishikawa Fishbone Diagrams