XmR Median R Chart Formulas
The XmR Trend chart can help you evaluate process performance using variable data when there is only one measurement per period and the data may contain trends (e.g increasing cost due to inflation, decreasing cost due to technology, etc).
Here is the formula used to calculate the Trend chart in the ChartSmartXL.
(Source: Statistical Methods for the Process Industries, W McNeese and R Klein, ASQ Press, Milwaukee, pg. 280-290)
UCL and LCL are the same as for the XmR chart formulas.
The only difference is how the X center line (CL) is calculated using linear regression to give you the slope of the trend and a y-intercept value: "b", calculated as follows:
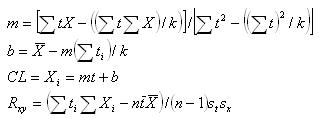
time(i)=ti=1,2,3,4....k for each X value
m=slope
b=intercept
The XmR trend then calculates the linear correlation coefficient (Ryx) for the degrees of freedom (df=k-2).
If Ryx is greater than the probability for this degree of freedom, you have a "significant correlation" between x and y. (Probability that you will conclude there is no correlation when there is one = alpha = 0.05).
If Ryx2 is greater than 0.80, then the correlation indicates a "useful fit."
What does this mean?
Significant correlation - A measure of x versus y. Is the relationship between x and y statistically significant? This is a measure of how well the trend line reflects the relationship between x and y.
Usefit Fit - Even if there is a significant correlation above this asks the question - Is it useful? Can I make an assumption or prediction about y based on past history?
A measure of the variation in x vs the variation in y.
This is a measure of how the points vary within the control limits.
| df | Probability | df | Probability | df | Probability | df | Probability |
| 1 | .997 | 11 | .553 | 21 | .413 | 35 | .325 |
| 2 | .950 | 12 | .532 | 22 | .404 | 40 | .304 |
| 3 | .878 | 13 | .514 | 23 | .396 | 45 | .288 |
| 4 | .811 | 14 | .497 | 24 | .388 | 50 | .273 |
| 5 | .754 | 15 | .482 | 25 | .381 | 60 | .250 |
| 6 | .707 | 16 | .468 | 26 | .374 | 70 | .232 |
| 7 | .666 | 17 | .456 | 27 | .367 | 80 | .217 |
| 8 | .632 | 18 | .444 | 28 | .361 | 90 | .205 |
| 9 | .602 | 19 | .433 | 29 | .355 | 100 | .195 |
| 10 | .576 | 20 | .423 | 30 | .349 |
(Source: Statistical Methods for the Process Industries, W. McNeese, ASQ Quality Press, Milwaukee)
Other Resources
The XmR Median R chart is just one of the tools included in the ChartSmartXL for Excel.
To create a Xmr Median R Chart using ChartSmartXL...
60 Day Money-Back Guarantee
To create a Xmr Median R Chart using ChartSmartXL...
60 Day Money-Back Guarantee